To create a Sparklines cell, you’ll need an Excel spreadsheet with some data.
How to Create Sparklines From Data
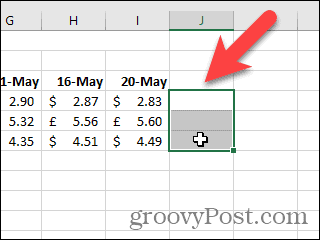
Select the cell(s) where you want your Sparkline(s) to be. Remember that for each row or column of data, you can only use one cell. In our example, we’re going to create three sparklines, so we’ve selected three cells.
Click the Insert tab. Then, click Sparklines and select a type of sparkline. For our example, we chose Line.
The Create Sparklines dialog displays. On the worksheet, drag over the cells you want to include in the Sparklines graphs to select them. The fields on the Create Sparklines dialog are automatically filled in. Click OK.
Use the Sparkline tab to customize your Sparklines graphs. Markers are useful when creating the Lines style of Sparklines graphs. You can also change the Style and Color of the Sparklines graphs.
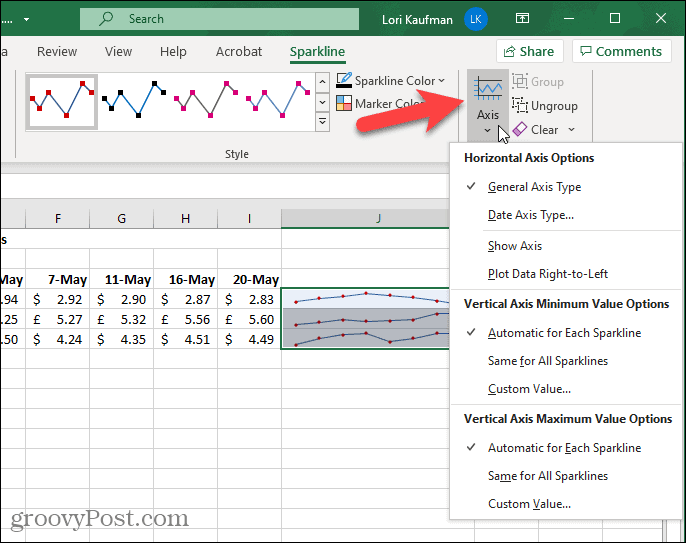
The Axis button on the Sparkline tab provides additional customization options.
You can also decide if you want to Show certain pieces of information on your Sparklines, such as the high points or low points.
You can change your mind about the type of Sparklines you want to show. Select at least one of the cells containing your Sparklines. Click a different type in the Type section of the Sparkline tab.
How to Customize an Excel Sparkline Chart with Color
Excel chooses default colors for the markers and lines/bars on the Sparklines. However, you can change the color of the various parts of the Sparklines charts. For our example, we’re going to make the high points orange instead of red. Select at least one of the cells containing your Sparklines. On the Sparklines tab, click Marker Color. Move your mouse over High Point and then click on the Orange box (or whatever color you choose to use).
There’s a third type of Sparklines called Win/Loss. Let’s take a look at this type of Sparkline chart.
How to Use Win/Loss Sparklines to View Data Trends
Simply put, the Win/Loss Sparkline displays Profit vs. Loss or, Positive vs. Negative that can help you view your data trends. You can also customize the Win/Loss Sparkline look the same way you customize the Line and Column types.
Make Your Data Stand Out
Sparklines are available for both Windows and Mac versions of Microsft Excel. Standard charts in Microsoft Excel are great for presentations but, there’s never enough room when trying to fit them into a spreadsheet along with all your other data. This is why we love Sparklines so much. They take up just a single cell and can surface large amounts of data, trends, findings. For even more bang, add a little color, and you can really impress those in your audience! Comment Name * Email *
Δ Save my name and email and send me emails as new comments are made to this post.


![]()
